
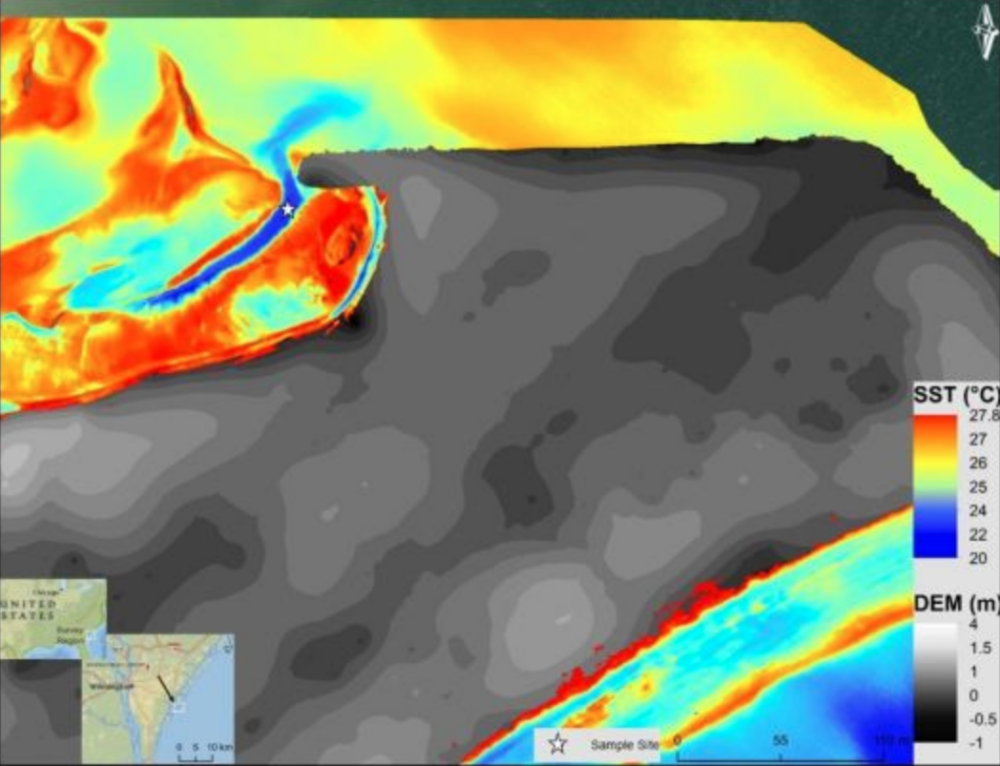
Nadir view of Masonboro Island UAS-TIR survey region overlaid on UAS-derived DEM
Submarine groundwater discharge (SGD) is a significant part of the water cycle that delivers anthropogenically derived and naturally occurring nutrients to coastal waters. As part of the drive to develop methods to prevent the degradation of coastal water quality, research conducted at the University of North Carolina Wilmington attempts to address the ambiguity associated with SGD point source locations.
This case study outlines how cutting-edge high-resolution unmanned aerial system (UAS) thermal infrared (TIR) imaging methods have been coupled with the newest technology for continuous and autonomous SGD monitoring.
Submarine groundwater discharge – the process in which groundwater flows down-gradient through a connected coastal aquifer from land into the ocean – is recognized as a significant pathway of dissolved components from land to the coastal ocean. Locating sources of SGD is important because SGD often carries pollutants from anthropogenic sources, e.g. nutrients from sewer systems or agricultural activities on land.
UAS-TIR Imaging Methods
However, precisely locating SGD is challenging because the distribution of these sources along the coastline is not uniform, and the same is true about the magnitude of groundwater discharge. This allows high-resolution UAS-TIR imaging methods to be implemented to observe SGD mixing characteristics. Prior to UAS-TIR imaging, spatial and temporal ambiguity made SGD difficult to evaluate.
Narrowly Avoiding a Drone Crash
During the project, the researchers were involved in a near-miss with a Lidar surveying plane while piloting the eBee. The unmanned aerial vehicle (UAV or ‘drone’) was being flown on Masonboro Island just a week after Hurricane Florence had passed through Wilmington. This was a standard flight that had been completed several times before. Of course, the researchers had checked the airspace to make sure there were no conflicting flights. Everything was going exactly as planned until, on the horizon, they noticed a large recreational aircraft approaching at an alarmingly low elevation.

Immediate evasive action was required to land the drone safely and avoid a crash. The situation was particularly intense because of the study site’s location on a barrier island that is only 300m wide. There were two options for landing: to either make a rapid spiral descent at the eBee’s current location, or to return to the take-off location for a predetermined landing with a modified approach direction. The researchers quickly decided on the second option, given the limited room for error when flying expensive electrical equipment so close to open water. Luckily the drone made a safe landing, just moments before the plane – which was assessing the post-hurricane Florence impact on the island – passed directly overhead.
Methodology
All imagery collected from the field was stitched together using Pix4D processing software to create accurate orthomosaics of UAS-TIR data which identified SGD plumes within the survey region. An eBee Plus professional drone equipped with a high-resolution senseFly thermoMap sensor, capable of detecting 0.1 ⁰C was used for image reconnaissance. Upon collecting UAS-TIR imaging data, in-situ water conductivity, temperature and depth, and groundwater tracer isotopes were recorded with a YSI and RAD-7. The RAD-7 Aqua circulates seawater from an intake valve from the sample site into an air-water exchanger by a peristaltic pump, enabling positively charged radium isotopes to be released into a closed-air loop that is attracted to a ground potential semiconductor in the RAD-7 where it is measured.

Measurements were logged continuously and autonomously at 30-minute intervals over multiple tidal cycles. Measurements were recorded within the SGD plume to ground-truth the sea-surface temperature (SST) measurements recorded by the UAS-TIR imagery. Calculations for converting 222Rn volume measurements into groundwater seepage flux were applied using the Burnet and Dulaiova (2004) mass balance model. Further calculations were made using the SGD plume contour area in addition to the shoreline area.
UAS-TIR Imaging of Bald Head Island Tidal Creek
Results from the UAS-TIR flight conducted on 7 December 2018 over Bald Head Island Tidal Creek are shown in Figures 2 and 3, including the position of stationary radon sample platforms. The imagery was collected at approximate low tide to capture maximum groundwater discharge because of greater hydraulic head difference between the discharge location and the riverbank. The reconnaissance mission entailed multiple flights due to the limited flight time of the UAS and the broad aerial extent of the survey region.
The results from the Bald Head Island UAS-TIR survey (shown in Figure 1, overlaid on a 10m digital elevation model (DEM) generated from USGS 3DEP) enable a direct correlation to be observed between hydraulic gradient and groundwater discharge. This is possible because groundwater discharge along North Carolina’s coastline is predominantly colder than ambient ocean water and, because a significant proportion of the discharge is fresh, it floats buoyantly on the ocean surface.
UAS-TIR Imaging of Masonboro Barrier Island
The UAS-TIR flight conducted on 20 June 20 2018 over Masonboro Island was performed at low tide to capture the maximum groundwater seepage. The reconnaissance mission took place early in the morning. The results from the Masonboro Barrier Island UAS-TIR survey (shown in Figure 4, overlaid on a 5cm/pixel digital elevation model generated from UAS RGB imagery) enable a direct correlation to be observed between hydraulic gradient and groundwater discharge.

A scour feature exists where the prominent cooler groundwater discharge plume is observed. To further investigate the scour at the sample site, bathymetry was modelled (Figure 5) using a vertically exaggerated spatial interpolation created using continuous control points recorded below the water surface with an R8 RTK unit. The results were overlaid with the UAS-TIR imagery to enable interpretation of the effect of hydrologic gradient on groundwater discharge.
UAS-TIR Contour
To calculate a ∆T1 contour surface area, the plume surrounding the radon sampling platform was contoured by processing in ENVI using the ROI tool. The calculated ∆T1 contour surface area (shown in Figure 6A) at this location was 2,315.739m². This area is represented by the darker blue anomaly shown in Figure 6B. This anomaly represents groundwater discharge at the sampling site.

Geochemical Tracer Results
The data recorded by the continuous autonomous RAD-7 displays an inverse correlation between tidal stage and 222Rn (Bq m-3) observed at the Bald Head Island Tidal Creek sample site. This relationship (shown in Figure 7) is typical because of water level inversion with a change in the tidal stage.
Using the mass balance approach, 222Rn (Bq m-3) inventories can be converted into a flux calculation in m day -1. This volumetric discharge estimate allows for comparison to literature as well as adjacent sample locations. It is important to calculate a volumetric flux to compare sample locations because hydrogeological settings vary with location and can significantly impact geochemical tracer results.
Conclusion
The results of this study demonstrate the utility of UAS-TIR imaging in quantitatively modelling SGD in coastal North Carolina. YSI data from both sample sites demonstrates that SGD contributes to an overall decrease in salinity and pH. The larger ∆T1 contour surface plume area at the Masonboro Island survey site of 2,315.739m² responded with a mean discharge volume at the sample point of 0.8962m day ˉ¹. This compared to ∆T1 contour surface plume area at the Bald Head Island Creek study site of 1,391.31 m² yields lower mean discharge volume of 0.6097m day -1. The difference in the SGD flux correlates to UAS-TIR plume area contour mapping at each sample location.

Isolating the sample locations utilizing the UAS-TIR imagery within the survey area enables a quantitative evaluation of the daily SGD flux contributing to the tidal inversion. The resulting Bald Head Island tidal creek sample area mean discharge contribution is qA = 0.0281m day -1. The resulting Masonboro Island sample area mean discharge contribution is qA = 0.0496m day -1. This value also correlates with the surface area extent of the ∆T1 contour surface plume captured with UAS-TIR imagery. In conclusion, this study has demonstrated the effective use of UAS-TIR as a utility for observing SGD discharge plume mixing characteristics which allowed for reconnaissance of more precise locations of SGD.

Acknowledgements
The inspiration for this research project stems from being an undergraduate research assistant under the supervision of Dr Henrietta Dulai at the University of Hawaii (UH) at Manoa, where autonomous radon monitoring techniques were implemented in a coastal pond to sample submarine groundwater discharge.
References
Burnett, W., and Dulaiova, H., 2003, Estimating the dynamics of groundwater input into the coastal zone via continuous 222Rn measurements: Journal of Environmental Radioactivity, v. 69, p. 21-35.
Ghoneim, E., 2008, Optimum groundwater locations in the northern United Arab Emirates: International Journal of Remote Sensing, v. 30, p. 5879-5906, doi:10.1080/01431160801932517.
Kennedy, J., 2016, Coupling aircraft and unmanned aerial vehicle remote sensing with simultaneous in situ coastal measurements to monitor the dynamics of submarine groundwater discharge (Master’s thesis): Honolulu, University of Hawaii at Manoa, p. 75.
Source: Hydro